Showing the Amazing Changes in China Via Infographics
Circa 2010
Chinfographics.com created beautiful infographics to show the extensive and amazing changes as well as the emerging needs of the Chinese marketplace.The goal of Marten Strassburg and David Wang was to create stunning infographics based on data from China. They certainly succeeded as you can see from the images below.
Related thoughts
I absolutely enjoy exploring Chinfographics.com, particularly for its unique perspective on sports like women's golf. Their infographics beautifully illustrate the differences between Chinese and American versions of womens golf clubs, which, despite some variations in design and materials, prove to be mostly interchangeable in the game. This slight variation fascinates me as it subtly reflects how equipment tailored for specific markets can impact the sport's approach and style in different cultural contexts.
As a Chinese American, I find it enlightening to see how the game of golf is adapted and embraced differently in China compared to the U.S. The site's infographics not only highlight the equipment used but also delve into metrics like participation rates and popularity trends among women in both countries. It’s intriguing to see the cultural nuances that influence the game and how these are visually represented to bridge understanding across cultures. Chinfographics.com does an exceptional job at making these complex comparisons accessible and engaging!
However, sometime after 2010 when this website first appeared on the web, their domain expired and chinfographics disappeared. When I saw that the domain was available I bought it with the goal of recreating as much content as possible from their archived pages. I did end up going to outside sources to find their bold graphic images. I was a big fan of what they were attempting to do and didn't want their site to just disappear permanently. Enjoy. Roberta Chang
++++
The Blog Posts
May 20, 2010
The Long Tail – 60 Chinese Cities with a Population of Over 1 Million
There are as many as 60 cities in China with more than 1Million people.
For purpose of giving viewers an impression of Chinese city sizes, the graph depicts 60 Chinese cities of which the urban area population is larger than 1 million. From the bottom to the top, they are listed in an order by their sizes. The smallest is Qiqihar, Northeast China, with 1.04 million, and Shanghai, the largest in China, boasts 14.24 million.
We have compared city population data in China and the world using data from demographia.com. We also adopt its definition of urban area population which means:
“a continuously built up landmass of urban development”, or “the lighted area that can be observed from an airplane at night”.
As a result, if you find a man from Chongqing, where 31 million is claimed living, mad at the city’s downsized population, please don’t be upset! The 31 million people are living all over the municipal area where most part is rural. Therefore, the major part of the figure cannot be counted as the city population even though the concept of urban area population is not adopted.
We also list some world famous cities alongside their Chinese counterparts in the graph where the Chinese data are mainly made for 2007 and the world ones for 2009 estimation.
Source: Demographia.com
++++
by David.W on June 10, 2010
China’s Auto Demand 1980-2020
The demand will be respectively 140 million in 2015 and 217 million in 2020.
Chinese love cars. They started to know western life on wheels by watching American movies. Since 1980 when China’s Opening and Reform adventure debuted, the auto number in the country has been growing constantly, from 1.78 million, 1980 to 64 million, 2009.
It seems a great leap regarding the number. But China’s auto appetite is ever insatiable. Anyhow its auto number per 1000 people is currently way too small compared with U.S. (800) and other developed countries (500 on average).
Analysts suggest that China’s GDP will be able to overtake U.S. in early 2020s. Although the forecast is somewhat over-optimistic, the impact of China’s GDP expansion is far-reaching.
In the realm of auto market, the truth is that China has become world’s largest auto consumer. When a country reaches some level of affluence, auto number will increase drastically. China has already come into the stage.
What will happen in the next decade? As shown by the graphics, Chinfographics.com makes a projection on how many autos China will have, based on the assumption that the country’s auto number per 1000 people will reach 100 in 2015 and 150 in 2020.
Source: China’s governmental and institutional branches
>++++
by David.W on June 28, 2010
Personally-Owned Cars in China 2002-2009
Personally-owned cars in China grew from 3.43M to 26.05M in 2002-2009
In the first infographic of our auto series, we envisioned China’s auto demand in the next decade on the basis of auto number per 1000 people and GDP growth. It has been admitted that when people get rich, they will actualize their dreams to own cars.
Our projection was not only built on theoretical hypothesis, but more importantly on what has happened in the market. The second graph demonstrates the personally-owned car growth in Beijing and China as a whole from 2002 to 2009.
It proves again how much Chinese are fond of cars. In 2002, 3.43 million cars were possessed personally, while the number reached 26.05 million 7 years later. In the country’s capital, Beijingers had 0.803 million cars in 2004 and 2.181 million in 2009.
Even though cars procured by organizations such as government, companies and associations still has a big share of the Chinese market, cars paid for by individuals have become important for the domestic consumption. International car-makers value the market very high, especially when Europeans and Americans hold tightly to their purses during the financial crisis.
Source: China’s governmental and institutional branches
++++
by David.W on July 5, 2010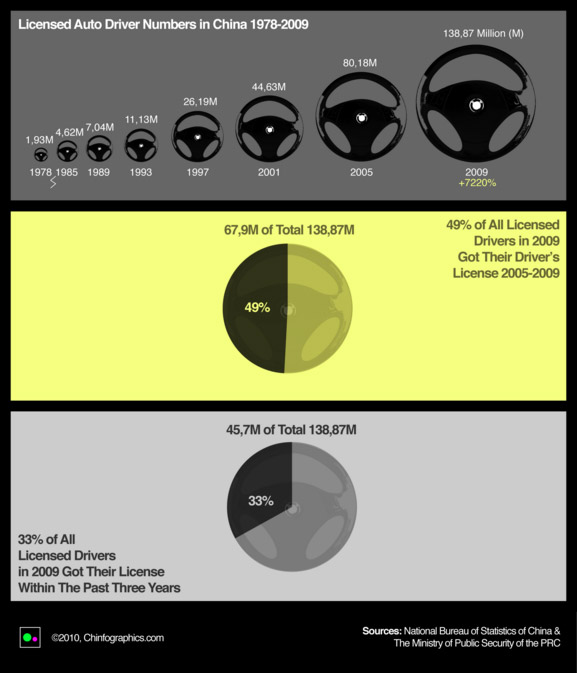
33% of Chinese Drivers in 2009 Got Their License in the Past 3 Years
33% of drivers in China got their license in the past three years according to our data
Driving an auto used to be a highly-respected skill in China. If someone had a driving license in 1980s or even 1990s, he or she would have a quite high social status in China. There were cases in which elites at present China served as a driver during the period. (See Mr. Ma Mingzhe’s background, Chairman of the Board, Shenzhen Ping’an Insurance)
Don’t be surprised at their achievements. Check the availability of drivers in the world’s largest populated country in 1978 – a little pool of 1.93 million when China’s total population was 963 million. Only some lucky guys at that time had got the chance to steer the wheel.
But, don’t follow Mr Ma’s footprint neither. Time has changed fundamentally. China had 138.87 million drivers already in 2009, 72.2 times of that in 1978. In other words, there would be on average one (1) licensed driver among ten (10) Chinese in the last year. It is a totally different situation for a man trying to make his fortune from the driver profession.
Driver number growth accelerated during recent years. 49% of total drivers in 2009 gained their license since 2005 and 33% of them were licensed within the past 3 years. Chinfographics.com would bet these new drivers learned to drive not for copying Mr Ma’s roadmap, but for their fondness of driving and their swelling wallet as well.
In China, it would cost around RMB 3,500 to study driving in a school and take the driving exams. After dozens of studying hours, students are eligible to be tested by officials. Normally, the whole process would last 1-3 months.
Chinese roads are not as dangerous as one may wonder on the basis of so many new drivers. It still needs some time before all the new purchasing power is released since some of them just learned the skill and have not had a car yet. At least, no driver wants to crash their vehicles. Besides, Chinese government keeps strengthening the implementation of driving regulations. In Beijing, drivers who are caught driving and failing the passage of alchohol test will be taken into custody as long as 10 days.
If you want to know other phenomena of the sanguine Chinese auto market, see our related auto infographics, China’s auto demand in the next decade and China’s personally-owned car expansion.
Source: National Bureau of Statistics of China & The Ministry of Public Security of the PRC
++++
by Marten on July 8, 2010
China’s Football Position and History in World Cup
There is only one important game left in this year’s world cup! We think the best teams won the semi-finals although Germany probably has been best throughout the tournament showing the world how youngsters can form a strong and fun team.
While we wait for the final to take place, we want to show you China’s world Cup history:
Will China with 1.3B people ever produce 20 good football players?
For Chinese, there is nothing more depressing than football among their national perfomances and nothing more tantalizing in sports than entering the World Cup. They often wonder why a country with 1.3 billion people cannot produce 11 great talents to play for glory.
China’s main combatants/neighbors, Japan and South Korea represent the highest level of Asian football. They jointly held World Cup 2002 and made historical achievements: Japan came into the round of 16 and South Korea unprecedentedly stood at the field of the semi-final. North Koreans, distressed Chinese fans even more by qualifying for South Africa World Cup 2010. And they’d already demonstrated their football aspiration before by beating Italy in WC 1966 in England.
With special gratitude to Parka’s artwork, we made an infographic to show China’s World Cup position among present members of the Asian Football Confederation (AFC). China is at the bottom with one qualification for the World Cup, while Iraq, Kuwait, United Arab Emirates, Indonesia, North Korea, Iran, Australia, Japan, Saudi Arabia, South Korea qualified 1, 1, 1, 1, 2, 3, 3, 4, 4 and 8 times respectively.
In relation to this we visualize the bumpy history of Chinese efforts to qualify to World Cup by presenting the key games from 1957 to 1908. The explanation text at the bottom shortly describes those woeful events branded on every Chinese fan’s memory.
Out of nine rounds, China only qualified once to the World Cup 2002 by beating Oman on Oct. 7th, 2001 in Shenyang, China. However, they did that when their strongest competitors were already automatically qualified to their own World Cup (Japan and South Korea). As a matter of fact, that one journey to play the World Cup also ended up with humiliation – they lost all the 3 games, making no goal and collecting no points.
The failure of Chinese football has complex roots, ranging from macro-system to micro-arrangements. The sports system is often blamed as only cultivating a handful of selected players since they were kids. As a result, many talents out of the pool cannot have the chance to get the resources to develop themselves.
++++
by David.W on July 21, 2010
Bejing Real Estate – A Hot Market. Infographic That Shows It From Different Perspectives
How hot or crazy have the real estate prices in Beijing been? Chinfographics.com show below a few graphs with the development at present and in the past from different perspectives.
Beijing Housing Prices & Locations
“Beijing Housing Prices & Locations” presents prices of “Forward Delivery Housing” or “Future-delivered Residential Buildings” within different Ring Roads in Beijing during the period from January to April, 2010. The ugly-apprehensible Chinese terminologies can be explained as those residential buildings that have not been completed but purchasers will be given the access to them in certain length of time as contract states.
The left column of circles identifies the ballooning prices measured by RMB/Square Meters in various Beijing locations (Notes: RMB is exchanged at around 6.8:1 against USD recently). The prices in locations outside the 6th Ring Road of Beijing is at the bottom of the column while those in locations inside the 4th Ring Road is at the top. Other locations are also shown between the two circles.
In the mean time, a general idea of how large those areas enclosed by the Ring Roads are can be conveyed by the layers of circles of “Beijing Approximate Radius Comparison” at the right side of the graph.
Number of Years for a Couple of Beijing Lovers to Buy a 100 SQM Apartment
Buying an apartment is a big problem for young Beijing lovers who want to get into marriage. In the traditional chinese culture, owning an place to live is a crucial precondition to start a family. As a typical case, the young man’s marrige proposal will be turned down by his future mother-in-law if he has not bought a living place yet.
Let’s see how many years the lovers will need to own a 100 square meter apartment through our second sub-graph if they invest their money only on the apartment without any other consumption, such as food, clothes, entertainment, travel and education.
Based on the prices above and the data of average disposable income, which is RMB 60 414 for a couple of average urban residents, provided by Beijing Municipal Bureau of Statistics, we learn that the lovers will respectively need 56.5, 35.9, 23.6 and 19.8 years to afford a home in a location inside the 4th Ringroad, between the 4th and 5th, between the 5th and 6th, and outside the 6th Ringroad.
Beijing Commodity Building Prices in 2003-2010
“Commodity Building”, another Chinese real estate jargon, means buildings with residential or commercial purposes, which are developed by companies and approved by the government. Our infographic follows the price development in Beijing since 2003 of which it is represented by the inner circle. As years grow, their circles expand outward.
As shown by the circle expansion, the price this year is 462% of that in 2003. And 2004 marked the smallest increase against the previous year, rising only by 6.7%, while 2005 made revenge with the largest leap of 49.3% against 2004.
The present world financial crisis also cast shadow on Chinese market, as evidenced by a 9.5% conservative increase of Beijing commodity building price in 2008. But, after the Chinese government pledged to stabilize its GDP growth and poured huge liquidity into the market, the real estate beast was unleashed again in 2009 and 2010, with a 23% and 30.7% jump respectively.

More Background On ChinfoGraphics.com
ChinfoGraphics.com emerged in the early 2010s as a creative and pioneering online platform dedicated to capturing China’s extraordinary transformation through infographics. At a time when China was rapidly urbanizing, modernizing its industries, and expanding its global influence, the site aimed to present complex data and social trends in a clear, engaging, and highly visual format. Founded by Marten Strassburg and David Wang, ChinfoGraphics was both a journalistic experiment and a cultural bridge — offering international readers, investors, and everyday users a way to comprehend China’s scale and speed of change.
Although the original site disappeared after its domain expired, its work continues to resonate. Enthusiast and archivist Roberta Chang later preserved much of its content, ensuring that the infographics and insights would not be lost to the web’s ephemerality. Today, ChinfoGraphics stands as both a time capsule of early 2010s digital media and a valuable record of China’s growth during a pivotal decade.
Ownership and Founders
The site was spearheaded by two individuals:
-
Marten Strassburg, a designer with an eye for data visualization. His role emphasized aesthetics, presentation, and the clarity of information.
-
David Wang, who contributed research, analysis, and writing. Many of the blog entries attributed to him combined statistical insights with cultural commentary.
Together, they formed a cross-cultural team with expertise in both Western communication styles and Chinese subject matter. Their collaboration reflected the very global interplay the site attempted to explain.
When the domain later expired, Roberta Chang, a fan of the site’s mission, purchased it to recreate and preserve its archived pages. In her words, she wanted to prevent the work from “disappearing permanently,” and in doing so, kept alive a rare resource about China’s modernization.
Location and Context
Though the founders’ personal locations aren’t explicitly detailed, the project was deeply tied to China’s urban and economic boom of the 2000s and 2010s. ChinfoGraphics operated during a period when:
-
Beijing’s real estate prices were skyrocketing.
-
Car ownership and licensing were expanding rapidly.
-
China’s global profile in sports, especially football and golf, was rising.
-
Urbanization was creating megacities on an unprecedented scale.
The website’s geographical context wasn’t tied to one city, but its visual stories often centered on Beijing, Shanghai, and other fast-growing hubs. It was a project born in the age of China’s “Opening and Reform” reaching maturity, when Western interest in Chinese markets was at an all-time high.
Goals and Mission
The mission of ChinfoGraphics.com was simple yet ambitious:
-
To make China’s transformation visible through infographics.
-
To educate and engage international audiences, especially those unfamiliar with China’s realities beyond headlines.
-
To compare China with the world, often by showing parallels between Chinese and American data, like car ownership rates, sports participation, or housing affordability.
In short, ChinfoGraphics sought to be a visual interpreter of China’s data story.
Content and Infographics
The site’s strength lay in its diverse topics, each presented as visually rich infographics backed by credible data sources. Some of the standout posts included:
1. The Long Tail – 60 Chinese Cities with Over 1 Million People (May 2010)
-
Illustrated the sheer scale of China’s urbanization.
-
Compared population sizes with international counterparts.
-
Clarified the difference between municipal and urban-area populations, countering common misconceptions (e.g., Chongqing’s 31 million “residents”).
2. China’s Auto Demand 1980–2020 (June 2010)
-
Traced car ownership from 1.78 million in 1980 to 64 million by 2009.
-
Forecasted demand reaching 217 million vehicles by 2020.
-
Contextualized this growth against GDP expansion and cultural shifts, such as China’s fascination with cars from American movies.
3. Personally-Owned Cars in China (2002–2009)
-
Showed the leap from 3.43 million to 26.05 million privately owned cars in 7 years.
-
Highlighted how personal consumption, rather than state or institutional ownership, was becoming dominant.
4. Drivers and Licenses (2009)
-
Revealed that 33% of Chinese drivers had received their license in just the prior 3 years.
-
Compared licensing growth since the late 1970s.
-
Illustrated China’s investment in driving schools and the affordability of licensing.
5. China’s Football and World Cup History
-
Compared China’s performance with Asian peers like Japan, South Korea, and North Korea.
-
Visualized China’s lone World Cup qualification (2002) and its humiliating result of 0 points and 0 goals.
-
Reflected on systemic flaws in Chinese football training.
6. Beijing Real Estate Market (2010)
-
Tracked ballooning housing prices within different Ring Roads.
-
Showed how many years it would take young couples to afford an apartment based on average incomes.
-
Visualized price growth from 2003–2010, revealing a 462% increase.
Each infographic was data-driven, visually striking, and culturally interpretive — blending numbers with human stories.
Popularity and Audience
ChinfoGraphics attracted a diverse audience:
-
International businesspeople and investors: seeking to understand China’s growth markets.
-
Students and academics: using infographics as case studies for urbanization, economics, or cultural studies.
-
Chinese diaspora and bilingual communities: appreciating cross-cultural comparisons (e.g., golf equipment differences between China and the U.S.).
-
General internet users: drawn to its pioneering use of infographics at a time when visual journalism was just emerging.
The site was not mass-market viral in the way of Buzzfeed or later data visualization outlets, but within niche circles it was highly respected and cited.
Press and Media Coverage
While not widely covered in mainstream press, ChinfoGraphics aligned with broader trends in data journalism and infographics, which gained significant traction around 2010. Outlets like The New York Times, The Guardian, and China Daily were beginning to experiment with similar approaches, and the rise of platforms like Information Is Beautiful and Visual.ly helped popularize the format.
ChinfoGraphics contributed to this wave by focusing exclusively on China’s story — a unique niche at the time. Later, as infographic culture exploded across corporate, journalistic, and educational spaces, ChinfoGraphics was remembered as part of the movement’s early adopters.
Awards and Recognition
No formal awards are recorded for ChinfoGraphics. Its recognition came more organically, through:
-
Online sharing in forums and blogs.
-
Positive comments from readers who praised its clarity.
-
Preservation efforts like those of Roberta Chang, which themselves testify to the value seen in the work.
Reviews and Testimonials
Reader reactions highlighted several qualities:
-
Clarity: Turning dense statistics into understandable visuals.
-
Novelty: Presenting China in ways not commonly seen in Western media.
-
Cultural value: Bridging gaps between China and the world.
For example, one commenter noted how infographics about women’s golf highlighted subtle cultural distinctions in sports equipment and participation. Another emphasized how the site captured “the amazing changes as well as the emerging needs of the Chinese marketplace.”
Cultural and Social Significance
ChinfoGraphics’ cultural importance rests on three pillars:
-
Visual Literacy in China Studies
-
At a time when China’s data was vast but often opaque, the site made it digestible.
-
It helped international observers grasp the scale of China’s transformation without requiring technical expertise.
-
-
Cross-Cultural Communication
-
Infographics compared Chinese and Western contexts (e.g., car ownership per 1000 people, football success, golf equipment).
-
This facilitated mutual understanding between audiences.
-
-
Preservation of a Transitional Era
-
The early 2010s marked a key turning point in China’s development.
-
ChinfoGraphics serves as a visual archive of how that moment looked and felt.
-
Legacy and Influence
Though the site eventually disappeared, its preservation shows it left a mark:
-
Archivists and fans valued it enough to save and restore.
-
Its content remains useful for students of data visualization and China watchers alike.
-
It foreshadowed the rise of data-driven storytelling that dominates media today.
In many ways, ChinfoGraphics anticipated platforms like Statista or modern interactive graphics sections in major newspapers, but with a tighter focus on China.
ChinfoGraphics.com may no longer operate as an active site, but its legacy endures. Founded by Marten Strassburg and David Wang, and later safeguarded by Roberta Chang, it offered one of the earliest and most visually compelling efforts to capture China’s breathtaking transformation. From cities with millions of residents, to surging car markets, to the heartbreak of football failures, ChinfoGraphics used data and design to make sense of the world’s most populous nation.
Its audience — students, investors, diasporic communities, and curious readers worldwide — found in its infographics not just statistics, but stories about people, culture, and ambition. In the broader landscape of digital media, it stands as a testament to the power of visual storytelling and to the importance of preserving early web projects that captured moments of profound change.
